Matplotlib

Matplotlib (BSD-Lizenz) ist eine 2D- und (noch experimentelle) 3D-Plotting-Bibliothek für Python und die NumPy-Bibliothek.
mplot3d
Die 3D-Erweiterung von Matplotlib heißt mplot3d und sie ist mittlerweile recht mächtig:
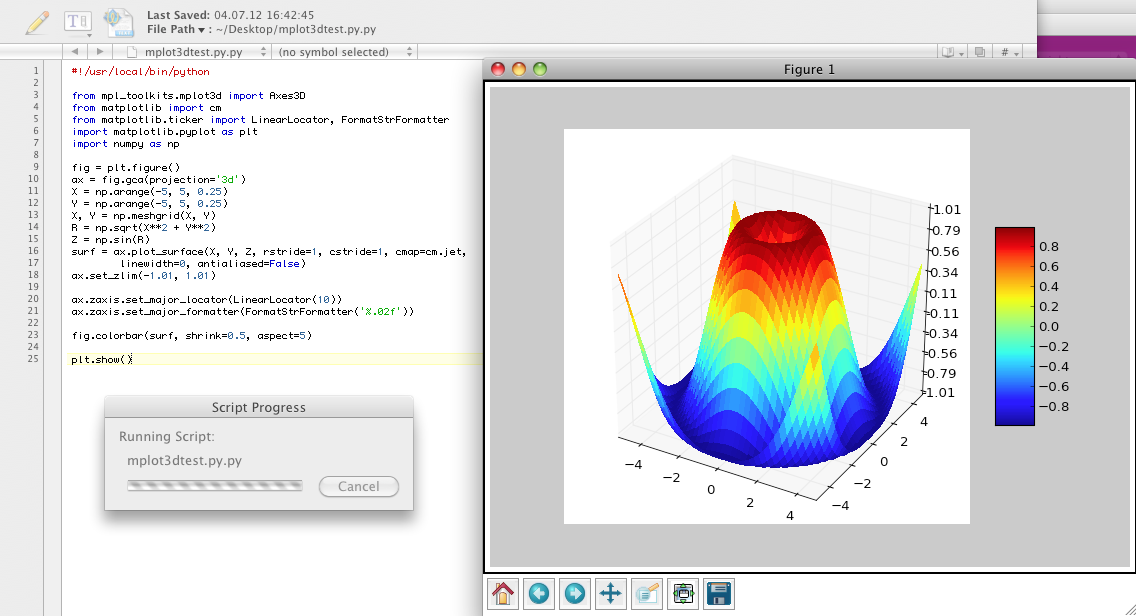
Obige Abbildung wurde mit folgendem Skript (aus dem Tutorial) erzeugt:
from mpl_toolkits.mplot3d import Axes3D
from matplotlib import cm
from matplotlib.ticker import LinearLocator, FormatStrFormatter
import matplotlib.pyplot as plt
import numpy as np

fig = plt.figure()
ax = fig.gca(projection='3d')
X = np.arange(-5, 5, 0.25)
Y = np.arange(-5, 5, 0.25)
X, Y = np.meshgrid(X, Y)
R = np.sqrt(X**2 + Y**2)
Z = np.sin(R)
surf = ax.plot_surface(X, Y, Z, rstride=1, cstride=1, cmap=cm.jet,
        linewidth=0, antialiased=False)
ax.set_zlim(-1.01, 1.01)

ax.zaxis.set_major_locator(LinearLocator(10))
ax.zaxis.set_major_formatter(FormatStrFormatter('%.02f'))

fig.colorbar(surf, shrink=0.5, aspect=5)

plt.show()
Links
- Matplotlib Home
- Matplotlib Users Guide
- mplot3d Tutorial
- mplot3d Examples
- matplotlib in der Wikipedia
Sie sind hier: Start → Programmierung → Python → matplotlib.txt